Debugging with the Virtual Controller
When developing Dobot+ plugins, developers can choose to connect to a real machine for development and debugging. If a real machine is not available, developers can still use a virtual controller for plugin development and debugging.
Applying for a Virtual Controller
Developers can apply for a virtual controller on the official Dobot website: https://www.dobot.cn/virtual.html
After obtaining the virtual controller authorization code, open the DobotStudio Pro client to authorize the virtual controller.
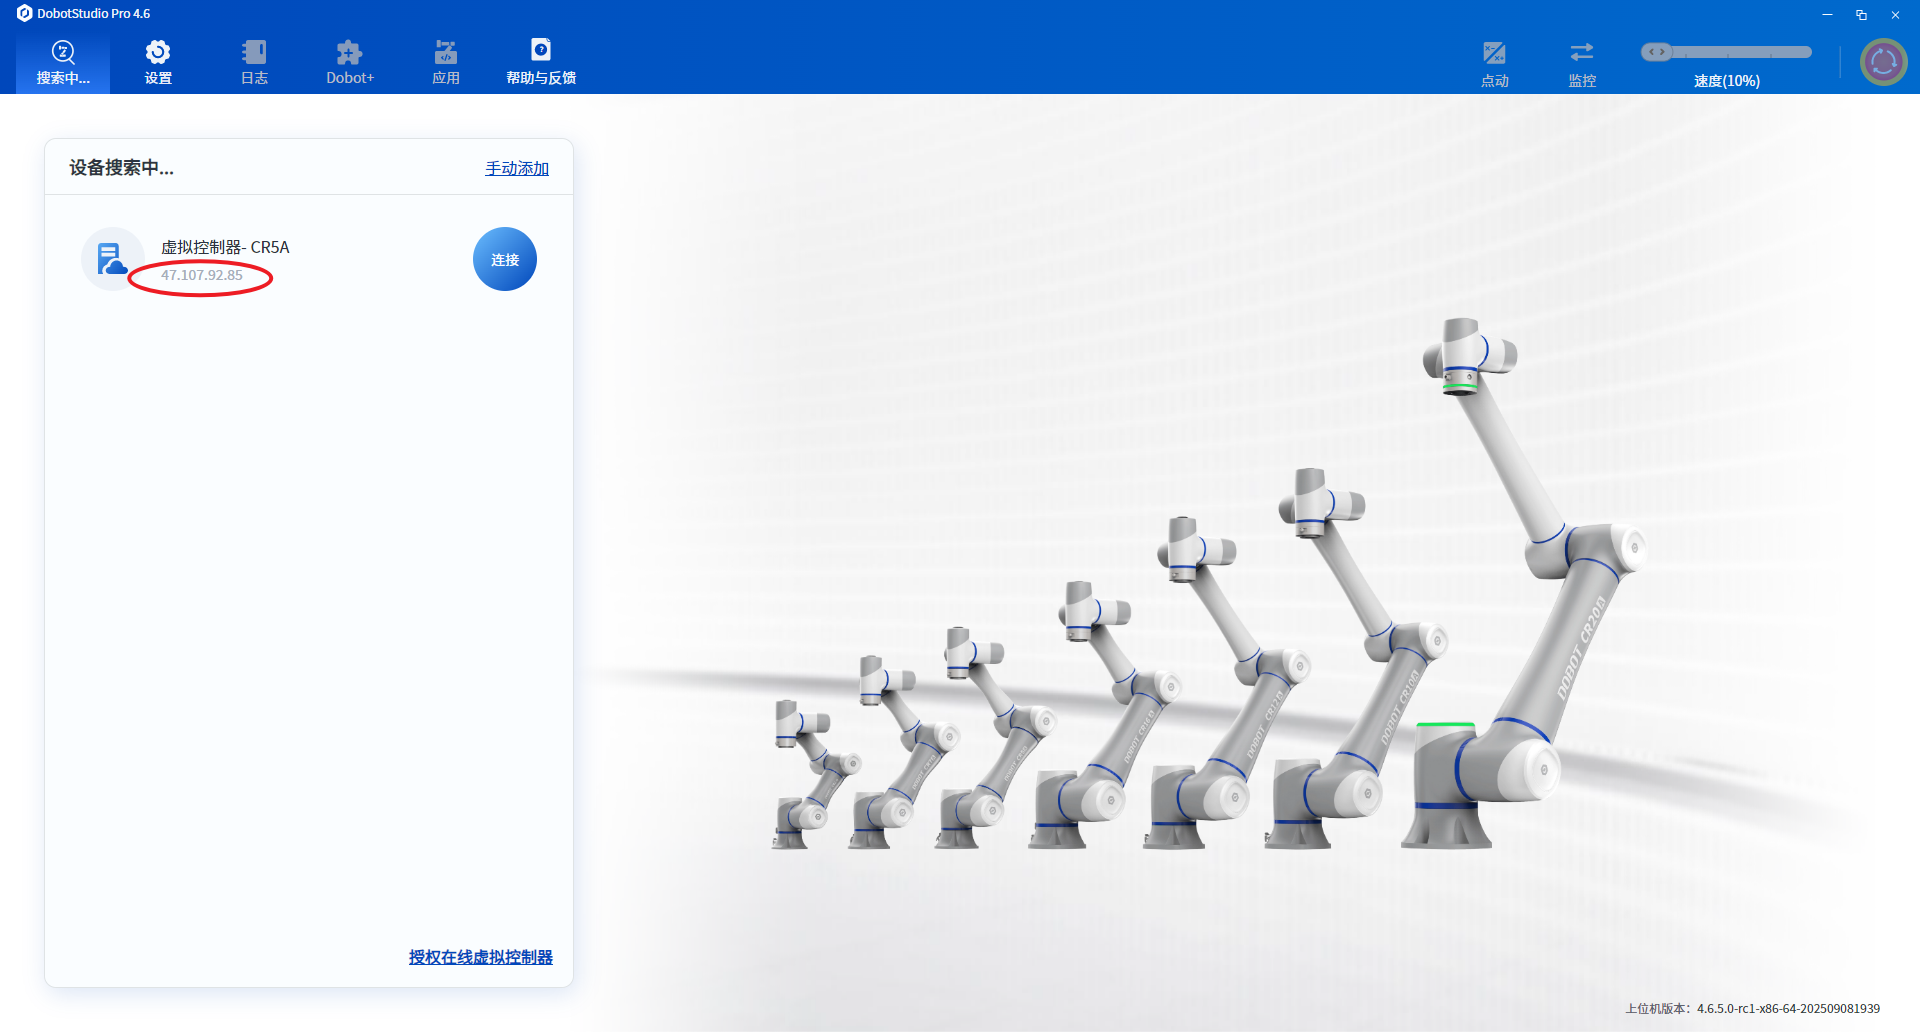
The DobotStudio Pro interface will display the virtual controller in the device list. Developers need to configure the IP address of the virtual controller in the Dobot+ plugin project.
Dobot+ Plugin Configuration
After completing the above steps, you will get the IP address of the virtual machine. In your Dobot+ project, locate the dpt.json file in the root directory:
{
  "ip": "47.107.92.85",
  "port": 22001
}
Change the IP field to the IP address of your virtual controller.
Running and Debugging
After configuring the virtual controller address, run the debug command in the project root directory:
dpt dev
Your browser will open http://localhost:8080/. If you can access this site normally, it means the interface and controller are connected and working properly. When you modify the project's Lua files, the site will automatically restart. Once the restart is complete, your Lua code has been successfully synchronized to the controller and is now in effect.